Clustering Illusion

aka Illusory Pattern Perception · Hot Hand Fallacy (related manifestation)

Seeing meaningful patterns in random data because streaks and clusters feel too unlikely to be coincidence.

Illustration: Clustering Illusion
WHAT IT IS

The glitch, explained plainly.

Imagine you're flipping a coin and you get heads five times in a row. Your brain screams 'That can't be just luck — something is going on!' But actually, streaks like that happen all the time when things are truly random. Your brain is just really bad at knowing what randomness actually looks like — it expects things to be much more evenly mixed than they really are.

The clustering illusion occurs when people observe inevitable clusters, runs, or streaks within small samples of random data and conclude that these groupings are non-random and meaningful. This bias stems from the deeply held but erroneous intuition that even short sequences should reflect the statistical properties of the larger population — what Tversky and Kahneman termed the 'belief in the law of small numbers.' People systematically underestimate how much natural variability occurs in small samples, so when they encounter a run of similar outcomes, they reject the possibility that it arose by chance. This illusion is especially powerful because it recruits two reinforcing biases: the representativeness heuristic makes the cluster seem 'too unlikely' to be random, while confirmation bias drives people to seek further evidence that the perceived pattern is real.

SOUND FAMILIAR?

Where it shows up.

  1. 01 A retail manager notices that shoplifting incidents happened on three consecutive Tuesdays. She reassigns extra security specifically to Tuesday shifts and drafts a memo explaining that Tuesdays are the store's 'high-risk day,' despite having only looked at three weeks of data from a store that has had random theft incidents for years.
  2. 02 A venture capitalist reviews a startup fund that had winning investments three quarters in a row. He allocates a large portion of his portfolio to the fund, reasoning that the fund manager has a 'proven system,' without considering that a three-quarter streak is statistically unremarkable given the number of funds in the market.
  3. 03 A public health official observes that five cases of a rare cancer appeared in the same small town over two years. She launches a costly environmental investigation into local water and soil contamination, despite statisticians on her team pointing out that, given the number of small towns in the state, several such random clusters are expected by chance alone.
  4. 04 A basketball coach benches his starting point guard after the player misses his last six free throws across two games, concluding the player is 'in a slump' and has lost confidence. He doesn't consider that a miss streak of that length is well within normal variance for a 70% free throw shooter.
  5. 05 A data scientist at a social media company notices that user engagement dipped on three consecutive Mondays. She builds an elaborate model for 'Monday fatigue' and presents it to leadership as a discovered behavioral pattern, without first running a statistical test to verify whether the dip exceeds what random fluctuation would produce.
IN DIFFERENT DOMAINS

Where it shows up at work.

The same glitch looks different depending on the terrain. Finance, medicine, a relationship, a team — same mechanism, different costume.

Finance & investing

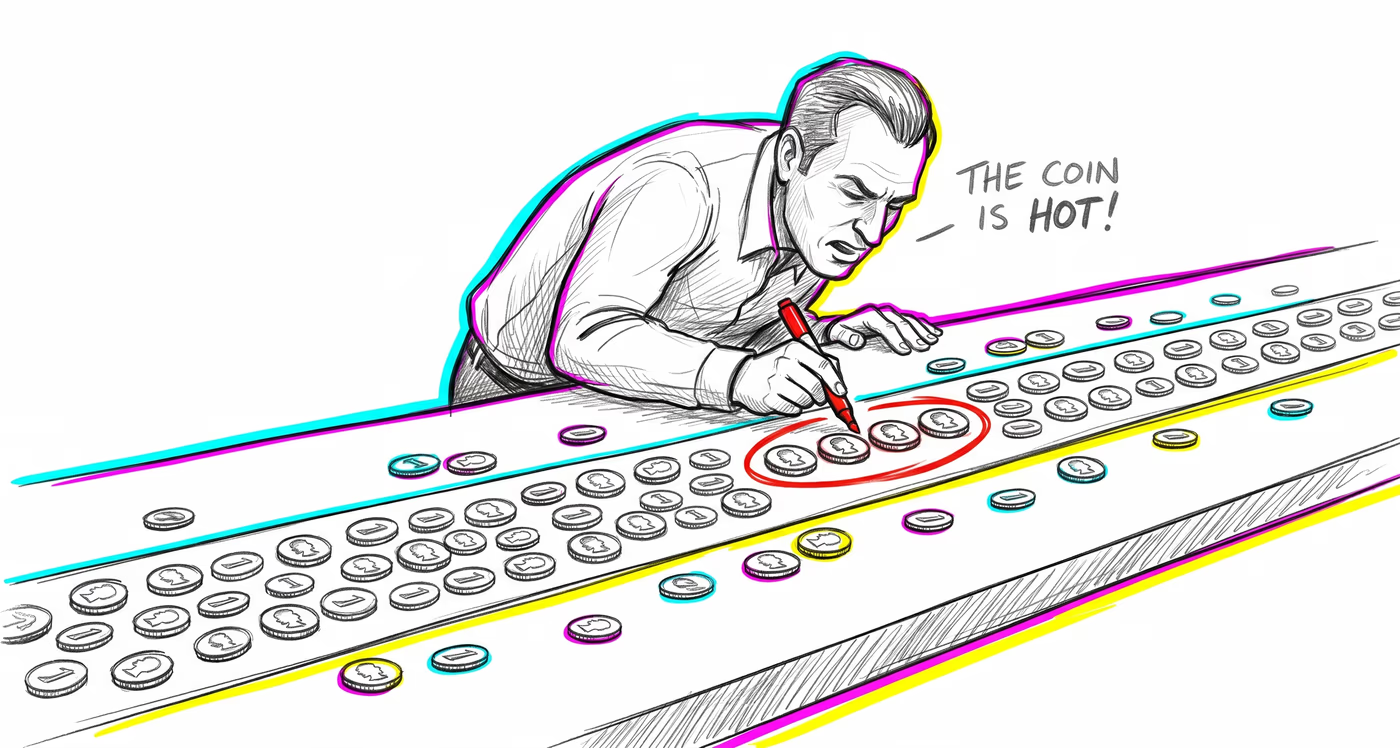
Investors frequently interpret short runs of positive returns in a stock or fund as evidence of a trend or skilled management, leading them to buy after a streak and sell after a dip — essentially trading on random noise. This pattern is especially dangerous in small-sample contexts like quarterly performance reviews.

Medicine & diagnosis

Random geographic clusters of rare diseases often trigger expensive investigations into environmental causes. Clinicians may also see a 'run' of patients with the same diagnosis and suspect an outbreak when the cases are statistically independent and the cluster is expected by chance.

Education & grading

Teachers may observe a student getting several answers wrong in a row on a test and conclude the student doesn't understand the topic, when in fact the error streak falls within normal performance variation. Conversely, a short run of correct answers may lead to overestimation of mastery.

Relationships

People interpret a streak of positive or negative interactions with a partner as a 'trend' in the relationship — for example, concluding the relationship is 'going downhill' after three consecutive arguments, without accounting for the natural variability of day-to-day dynamics.

Tech & product

Product teams may see a cluster of negative reviews on a particular day and rush to ship a hotfix for a nonexistent bug, or observe a short spike in conversions after a minor UI change and attribute it to the change when it's random fluctuation. A/B testing without proper sample sizes amplifies this bias.

Workplace & hiring

Hiring managers may perceive a 'bad streak' after three unsuccessful hires and overhaul their entire hiring process, or see a run of successful hires and attribute it to a particular interview question or technique, without evidence that the streak exceeds chance.

Politics Media

News outlets report on short-term clusters of events — several mass shootings in one month, or a string of political scandals — as 'trends' or 'crises,' when the clustering may fall within the range expected from random temporal distribution. This drives disproportionate public fear and policy reactions.

HOW TO SPOT IT

Ask yourself…

  • Am I concluding there's a pattern based on fewer than 30 data points?
  • Would I still see this pattern if the same data were shuffled into a different order?
  • Have I tested whether this streak or cluster exceeds what pure chance would produce?
HOW TO DEFEND AGAINST IT

The playbook.

  • Before concluding a pattern exists, ask: 'What would random data actually look like in this context?' — people consistently underestimate how 'streaky' randomness is.
  • Apply a base rate test: Calculate the probability of the observed cluster occurring by chance given the sample size before assuming it is meaningful.
  • Increase your sample size before drawing conclusions. Three data points are almost never enough to establish a pattern.
  • Use pre-registered hypotheses: Decide what pattern you're looking for before looking at the data, rather than finding a pattern after the fact.
  • Consult a 'randomness calibration' exercise — flip a coin 100 times and study the resulting streaks to build intuition for what randomness actually looks like.
FAMOUS CASES

In history.

  • During WWII, Londoners believed V-1 and V-2 flying bomb strikes were targeted at specific neighborhoods, but R.D. Clarke's 1946 statistical analysis showed the impact distribution closely fit a random Poisson distribution.
  • The 1913 Monte Carlo Casino incident where the roulette ball landed on black 26 consecutive times, leading gamblers to lose millions betting against the streak, convinced it 'had to' end.
  • The widespread belief in basketball's 'hot hand' was shown by Gilovich, Vallone, and Tversky (1985) to be largely a misperception of random shooting sequences, though later research has debated this finding.
WHERE IT COMES FROM
Academic origin

The foundational concept was introduced by Amos Tversky and Daniel Kahneman in their 1971 paper 'Belief in the Law of Small Numbers.' The term 'clustering illusion' was later popularized by Thomas Gilovich in his 1991 book 'How We Know What Isn't So,' building on the seminal 1985 study by Gilovich, Vallone, and Tversky on the 'hot hand' in basketball.

Evolutionary origin

In ancestral environments, detecting genuine patterns — such as recognizing animal tracks clustered near a water source, or noticing that certain berry patches appear in groups — provided critical survival advantages. Over-detecting patterns (a false positive) carried a low cost compared to under-detecting them (a false negative that could mean missing a predator or food source). This asymmetric payoff matrix selected for brains that are hypersensitive to clustering, even at the expense of frequent false alarms.

IN AI SYSTEMS

How the machines inherit it.

Machine learning models trained on small datasets may overfit to random clusters in the training data, treating noise as signal. Pattern-recognition algorithms, if not properly regularized, can detect spurious clusters in random data and present them as meaningful features. Recommendation systems may amplify clustering illusion by surfacing content based on short-term behavioral streaks that are actually random.

Read more on Wikipedia
FREE FIELD ZINE

10 glitches quietly running your life.

A free field-zine PDF — ten cognitive glitches named, illustrated, with a defense move for each. Plus the weekly Glitch Report on Fridays — one bias named, two spotted in the wild, one defense move. Unsubscribe any time.

EXPLORE MORE

Related glitches.

LAUNCH PRICE

Train against your blindspots.

50 cards are free to preview. Buyers unlock the rest of the deck plus the interactive training — Spot-the-Bias Quiz unlimited, Swipe Deck with spaced repetition, My Blindspots, Decision Pre-Flight, the Printable Deck + Cheat Sheets, and the Field Guide e-book. $29.50$59.

Unlock the full deck

Everything below — yours forever. Pay once, use across every device.

Half-off launch — limited to the first 100 readers. Auto-applied at checkout.
$59 $29.50
one-time payment · lifetime access
  • All interactive digital cards — search, filter, flip, shuffle on any device
  • Five training modes — Spot-the-Bias Quiz, Swipe Deck, Pre-Flight, Blindspots, Journal
  • Curated Lenses + Decision Templates + Defense Playbook
  • Printable Deck PDFs + Field Guide e-book + Cheat Sheets + Anki Export
  • Every future improvement, included
Unlock  $29.50

30-day refund · no questions asked